Note
Click here to download the full example code
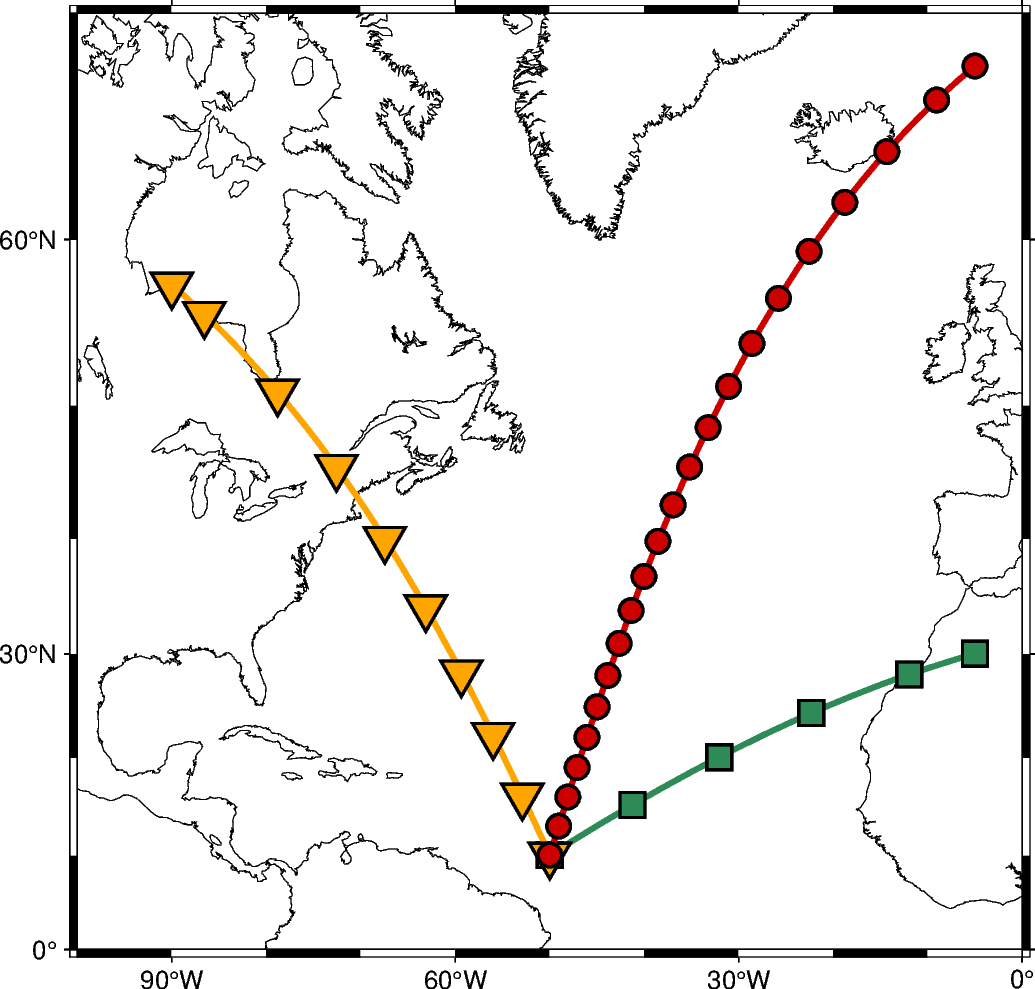
Generate points along great circles
The pygmt.project method can generate points along a great circle
whose center and end points can be defined via the center and endpoint
parameters, respectively.
Out:
<IPython.core.display.Image object>
import pygmt

fig = pygmt.Figure()

# generate points every 10 degrees along a great circle from 10N,50W to 30N,5W
points1 = pygmt.project(center=[-50, 10], endpoint=[-5, 30], generate=10)
# generate points every 750 km along a great circle from 10N,50W to 57.5N,90W
points2 = pygmt.project(center=[-50, 10], endpoint=[-90, 57.5], generate=750, unit=True)
# generate points every 350 km along a great circle from 10N,50W to 68N,5W
points3 = pygmt.project(center=[-50, 10], endpoint=[-5, 68], generate=350, unit=True)

# create a plot with coast and Mercator projection (M)
fig.basemap(region=[-100, 0, 0, 70], projection="M12c", frame=True)
fig.coast(shorelines=True, area_thresh=5000)

# plot individual points of first great circle as seagreen line
fig.plot(x=points1.r, y=points1.s, pen="2p,seagreen")
# plot individual points as seagreen squares atop
fig.plot(x=points1.r, y=points1.s, style="s.45c", color="seagreen", pen="1p")

# plot individual points of second great circle as orange line
fig.plot(x=points2.r, y=points2.s, pen="2p,orange")
# plot individual points as orange inverted triangles atop
fig.plot(x=points2.r, y=points2.s, style="i.6c", color="orange", pen="1p")

# plot individual points of third great circle as red line
fig.plot(x=points3.r, y=points3.s, pen="2p,red3")
# plot individual points as red circles atop
fig.plot(x=points3.r, y=points3.s, style="c.3c", color="red3", pen="1p")

fig.show()
Total running time of the script: ( 0 minutes 1.877 seconds)